Skip to content

Cookies 🍪

This site uses cookies that need consent.

Learn more

Zur Powderguide-Startseite Zur Powderguide-Startseite

Language selection

Search PowderGuide

SnowFlurry

SnowFlurry 13 2016/17 | Snow profile review

You learn to read snow profiles with examples, among other things

by Lukas Ruetz 01/27/2017
To loosen things up: surface hoop in XXL format

To loosen things up: surface hoop in XXL format

Lukas Ruetz
Sellrain Valley
In order to counteract the "I-only-understand-the-station" mentality when viewing snow profiles - whether in a snowflurry or on various avalanche warning service portals - we turn back to explanatory examples. As an introductory explanation, we recommend How to read and interpret a snow profile.

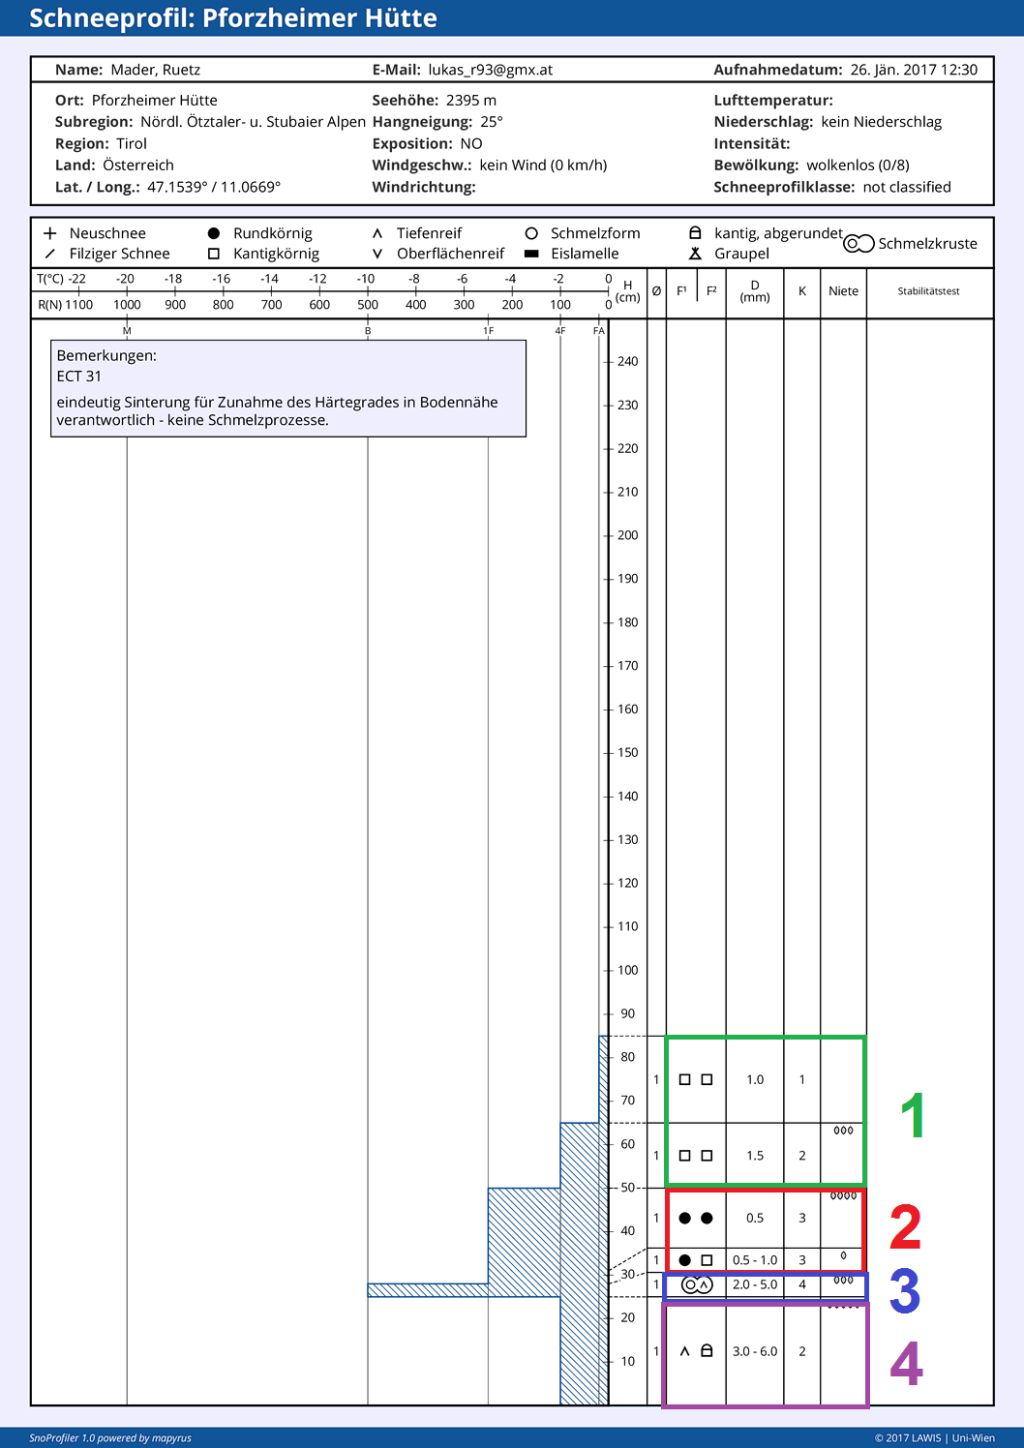
Profile Pforzheimer Hütte (Stubai Alps) from 26.1.2017

We see four main areas, distributed over a snow depth of 85cm. The superficial layers (1) consist only of angular crystals - in other words, they have been transformed to build up but are not yet in the form of floating snow. These crystal forms were created during the radiation nights, i.e. the cloudless nights of the last few days, when the snow surface was able to cool down massively due to the heat radiation emitted. As a result, a strong temperature gradient develops, especially near the surface. The snow lying there begins to become looser, i.e. it begins to build up.

This layer feels similar to powder snow when tracking and skiing, but trickles much more strongly and hisses characteristically when swinging. As a rule, you sink even further and more easily than in fresh powder snow. It is highly likely that the initial product before the transformation was powder snow, but it could also have been drift snow (round grains) that became increasingly loose. Due to the cloudless nights and the resulting build-up transformation of layers near the surface, the tensions decrease (the differences in hardness between the loose, weak layers near the ground and the harder layers near the surface become smaller) and the risk of avalanches decreases.

Below this is an area of degradationally transformed snow (2), i.e. round-grain forms. This can be old drift snow or simply fresh snow that has since undergone degradation. Areas 1 & 2 are the new snow since the beginning of January, areas 3 & 4 come from the snowfall in autumn and were mainly transformed during the warm and dry period in December.

Area 3 is a melting crust with a grain size of 2 to 5 millimetres and a hardness grade of 4 (blue bar to the left of the height indication shows the hardness grade). This means that it can no longer be penetrated with a finger, but only with a pencil. To the right of the spectacle symbol of the melting crust is also the symbol for "deep rime, floating snow" - the upright V. This means that the crust "is being or has been eaten up" - i.e. the melt lumps are being changed by the build-up transformation. The crust represents the old snow surface up to the snowfall at the beginning of January.

SnowFlurry
presented by

Below that, in area 4, there were certainly some other crusts from rain events and warm spells in October and November. However, these were completely dissolved by the constructive transformation and turned into floating snow (erected V), the crusts were completely "eaten up" and all other layers between the crusts were also constructively transformed. In the meantime, the degrading transformation has started again there, due to the ground heat and the weaker temperature gradient near the ground due to the now thicker snow cover (new snowfall) and the raising of the surface levels, recognizable by the symbol shape "angular rounded". The floating snow crystals become firmer again (hardness grade 2, blue bar), no longer trickle down as easily as sugar and become slightly smaller in diameter again - the process is called "sintering".

This means that two essential processes are currently taking place in the snow cover at this point: On the one hand, the constructive transformation in the layers near the surface, and on the other hand, the degradative transformation in the layers near the ground. Both can currently be seen as positive, because stress relief takes place. However, the constructive transformation in relation to the next snowfall is again negative.

Profile Marchenthorn (Northern Alps) from 26.1.2017

The picture in this profile is completely contrary. However, it is a different exposure and region - which easily explains the whole thing. The overview here shows a very good snowpack structure, as it is almost exclusively degraded snow - with only a thin, embedded melt crust but no weak layers. On the surface, the snow is moist due to the southern exposure, the slope steepness of 41°, the air temperature of just under 0°C, the altitude and the time of exposure around midday. The Extended Column Test (ECT) did not produce any fractures. The initial situation for further snowfall is positive here.

Profile Tuxerjoch (Tux Alps) from 23.1.2017

The snow profile on the Tuxer Joch in the Zillertal essentially shows three areas. On the surface (1) there is round-grained snow as a result of degradation or wind influence. In some areas, there is also felty snow (/), i.e. crystals that are still reminiscent of fresh snow. This is followed by an area (2) that is characterized by an alternation of crusts and layers that have been transformed by building up - this section is extremely inhomogeneous.

To loosen things up: surface hoop in XXL format

To loosen things up: surface hoop in XXL format

Lukas Ruetz
Sellrain Valley

This should set alarm bells ringing right from the start! In this case, the crusts are probably from October and November and the changeable weather conditions during this period: fresh snow, rain, warm spells, cold, rain, etc. As we are here on a north-facing slope at just under 2400m, the autumn snowfalls were able to remain, but it rained in between, mostly above 2400m - so you can see the effects of the weather very well at this location.

The aforementioned, decomposed snow, which contributes to the stress build-up, lies on top of this. An ECT was carried out here several times: The results varied, which indicates a difficult risk assessment. Sometimes the fractures break over the entire block (result: ECTP), sometimes in the same weak layer only over parts of the block (ECTN).

At the bottom (3) we find a crust that has little significance for avalanche formation. It takes a great deal of experience to work out this amount of layers cleanly from the profile and possibly assign them to the weather periods and thus draw conclusions about other regions, altitudes or exposures.

Note: Reading snow profiles is not rocket science. Interpreting them and drawing conclusions for practical use is more difficult. For the layperson - and therefore most winter sports enthusiasts - snow profiles are interesting in terms of understanding the process, but less so for tour planning or for their own risk assessment.

Photo gallery

This article has been automatically translated by DeepL with subsequent editing. If you notice any spelling or grammatical errors or if the translation has lost its meaning, please write an e-mail to the editors.

Show original (German)

Related articles

Comments

SnowFlurry
presented by